What It's For
Reports show you how your business is doing — sales, profits, top products, and more.
Where to Find It
Sidebar → Reports
What You'll See
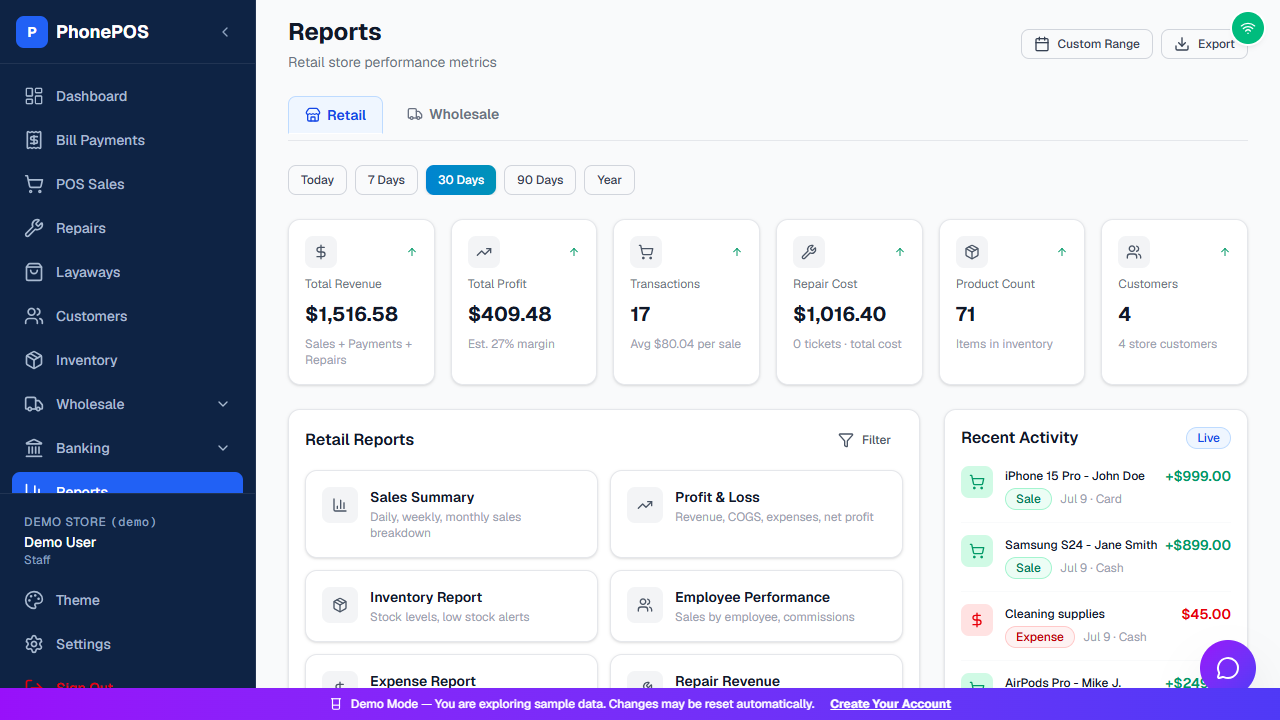
- Retail and Wholesale tabs
- Date presets: Today, 7 Days, 30 Days, 90 Days, Year (or Custom Range)
- Summary cards: Total Revenue, Total Profit, Transactions, Repair Cost, Product Count, Customers
- A Retail Reports list of report cards (see below), a Filter, and a Recent Activity panel (Live)
- Export button in the top right
Available Reports
| Report | What It Shows |
|---|---|
| Sales Summary | Daily, weekly, monthly sales breakdown |
| Profit & Loss | Revenue, COGS, expenses, net profit |
| Inventory Report | Stock levels, low stock alerts |
| Employee Performance | Sales by employee, commissions |
| Expense Report | Expenses by category |
| Repair Revenue | Revenue from repairs |
How To: Run a Report
- Choose the Retail or Wholesale tab
- Choose a date range (Today, 7 Days, 30 Days, 90 Days, Year, or Custom Range)
- Open a report card (e.g., Sales Summary)
- Use Filter to narrow the data
- Click Export to download the data
Tips
- Export to Excel: Reports can be exported as CSV files
- Date ranges: Use Custom Range for specific periods
- Compare: Run the same report for different periods to compare